This paper describes a conceptually-sound quantitative and practical approach to increase portfolio return/risk, details the requisite steps, and shows how they can be effectively performed using Moody’s Analytics PortfolioStudio®, a cloud-based, credit portfolio management solution designed with the business user in mind.
1. Introduction
Credit portfolios, consisting of loans, bonds, and other credit assets, make up a large portion of all assets on most financial institutions’ balance sheets. Hence, credit portfolio value, return, and risk are key drivers of shareholder/stakeholder value, return, and risk. Institutions can increase stakeholder value by increasing portfolio return/risk while also ensuring capital adequacy and regulatory compliance. This process, for the most part, requires five key steps:
- Measuring portfolio risk and ensuring capital adequacy
- Quantifying each exposure’s marginal impact on portfolio risk (An exposure’s marginal impact on portfolio risk is defined as the increase in portfolio risk for a dollar more of that exposure and is used to perform Steps 3−5)
- Setting limits to prevent excessive risk concentrations
- Increasing/decreasing credit exposure to increase portfolio return/risk
- Pricing and sizing new deals to increase portfolio return/risk
While Steps 4 and 5, ultimately, and most directly, increase stakeholder value, they cannot be effectively performed without first securing regulatory approval, favorable credit rating, and stakeholder confidence by performing Step 1, i.e., measuring portfolio risk and ensuring capital adequacy, then performing Step 2 to quantify each exposure’s marginal impact on portfolio risk, and then using the marginal measures to effectively perform Steps 3, 4, and 5. (Using marginal return/risk measures to perform Steps 4 and 5 leads to a portfolio with optimal (maximum) return/risk, where marginal return/risk impact is equal across all exposures in the optimal portfolio). Each of the five steps involves key questions and sub-steps that must be addressed and performed in order to increase portfolio return/risk and, thereby, increase stakeholder value.
Key Steps and Questions
1. Measuring portfolio risk and ensuring capital adequacy
a. Loss Distribution: How much capital is required to absorb possible portfolio losses?
b. Stress Testing: What are the expected losses and capital requirements under stress scenarios?
c. Reverse Stress Testing: What scenarios, borrowers, sectors/regions contribute most to large losses?
d. Capital Planning: What actions will be taken to maintain capital adequacy as stress scenarios unfold?
e. Risk Appetite: What are the target levels (risk appetite) and limits (risk tolerances) for risk taking?
2. Quantifying each exposure’s marginal impact on portfolio risk
a. Risk Contribution: What is the increase in portfolio risk for a $1 increase in exposure (notional)?
b. Risk Concentrations: Which borrowers, sectors, and regions impact portfolio risk the most?
c. Risk Attribution: Which factors cause and explain exposure’s Risk Contribution level?
3. Setting limits to prevent excessive risk concentrations
a. Segment Limits: What is the notional limit given a limit on each segment’s Risk Contribution?
b. Borrower Limits: What is the notional limit given a limit on borrower’s Risk Contribution?
4. Increasing/reducing credit exposure to increase portfolio return/risk
a. Asset Selection: Which exposures should be increased/decreased to increase portfolio return/risk?
b. Optimal Allocation: Which segments should be grown/reduced and by how much, in order to maximize portfolio return/risk (“Sharpe Ratio”)?
5. Pricing and sizing new deals to increase portfolio return/risk
a. Risk-Based Pricing: What is the deal’s Risk Contribution and Sharpe Ratio, i.e., deal’s marginal impact on portfolio return/risk, taking account of deal’s notional, standalone risk, and correlation with portfolio?
Designed with the business user in mind and delivered as a cloud-based application, and as described in the rest of this document, Moody’s Analytics PortfolioStudio® is an agile efficient solution to perform the five steps and their sub-steps and address questions listed above.
We organize the remainder of this paper as follows: Sections 2−6 describe quantitative approaches and methods for performing each of the steps listed above and sub-steps using PortfolioStudio. Section 7 describes additional functionalities of PortfolioStudio. Section 8 concludes.
2. Measuring Portfolio Risk and Ensuring Capital Adequacy
While regulatory requirements and expectations differ based on jurisdiction and institution type, most financial institutions understand the need to assess and ensure capital adequacy from regulatory, accounting, and economic perspectives, together with actual use of the capital adequacy assessment results and metrics. PortfolioStudio’s outputs inform, support, and enable regulatory, accounting, and economic decision-making by facilitating stress testing and calculating risk and return using CECL- or IFRS 9-based credit earnings, as well as economic or fair value methods.
Loss Distribution: How much capital is required to absorb possible portfolio losses?
PortfolioStudio uses the extensively validated Moody’s Analytics Global Correlation (“GCorr™”) framework, together with bottom-up Monte Carlo simulation, to simulate credit losses (due to credit migration and default) at a future horizon (typically one year) for each exposure in the portfolio, taking into account standalone risk, as well as portfolio correlations and risk concentrations.1 Exposure losses for all exposures and simulation trials are used to calculate the probability distribution of portfolio losses at the specified future horizon, and to calculate crucial portfolio2 risk metrics, including:
- Loss quantile (aka Credit Value at Risk (CVaR) or Economic Capital (“EC”))
Example: 99.9 percentile loss corresponds to the capital required to absorb all but the worst 0.1% of portfolio losses and can be compared with available capital (e.g. CET1) to assess capital adequacy. The quantile or confidence level (e.g. 99.9 percentile) can be specified in PortfolioStudio to match regulatory or economic requirements or the survival probability corresponding to the institution’s target credit rating. - Unexpected loss, i.e., standard deviation or volatility of portfolio losses at a future horizon
Note: Expected return and expected loss measures are also calculated and reported by PortfolioStudio. Institutions can choose whether PortfolioStudio calculates return and risk measures using loss based on economic or fair value or (optionally) loss based on CECL- or IFRS 9-based credit earnings. - List of macroeconomic variables ranked by their correlation with portfolio loss
PortfolioStudio’s portfolio overview functionality outputs the above risk metrics, together with portfolio loss distribution and other relevant metrics — all of which inform and support an institution’s capital adequacy assessment, capital planning and management, risk strategy, risk appetite, and risk tolerance, and are increasingly being reported and communicated both internally and externally.

Note: PortfolioStudio calculates return and risk measures and loss distribution using loss based on economic or fair value, or (optionally) loss based on CECL- or IFRS 9-based credit earnings.
Stress Testing: What are the expected losses and capital requirements under stress scenarios?
PortfolioStudio’s stress testing module uses a Monte Carlo simulation engine, together with the GCorr framework, to capture and calculate systematic factors’ (e.g. country and industry factors) and macroeconomic factors’ (e.g. GDP, unemployment rate, etc.) impacts on borrower credit quality and the resulting exposure and portfolio losses and credit earnings under user-specified or pre-loaded stress scenarios (e.g. CCAR scenarios). GCorr model coverage continues to expand and currently includes close to 1,000 total factors, including about 250 national, regional, and international macroeconomic variables.
PortfolioStudio’s single-period stress testing simulates portfolio loss and credit earnings to calculate, conditional upon a set of macrovariables at horizon, portfolio expected loss (or expected credit earnings) and loss quantile (or credit earnings at risk), which capture the uncertainty in loss (or credit earnings) due to uncertainty in factors other than those specified in the single-period stress scenario.
PortfolioStudio’s multi-period stress testing is used to calculate expected losses, loss distribution, and capital requirements for future quarters, given a user-specified multi-quarter macroeconomic scenario. PortfolioStudio first calculates stressed PDs for each borrower, at each period of the scenario, and then, using the stressed PDs as inputs, performs risk analysis and calculates results for each period during the multi-period scenario, thus yielding a term structure of expected loss (or credit earnings), loss quantiles (credit earnings at risk), and capital requirements.
Single-period and multi-period stress testing results from PortfolioStudio can be used to:
- Calculate expected loss, loss volatility, and capital requirements under stress scenarios
- Benchmark similar results from alternative models or estimates
- Assess capital adequacy, e.g. estimate the probability of exhausting the capital surplus by comparing distribution of portfolio loss and credit earnings and capital demand and supply under stress scenarios
- Meet regulatory and internal requirements for stress testing, communication, and disclosures
- Hedge assets, rebalance portfolio, set risk limits, and price risk based on sensitivity to stress

Reverse Stress Testing: What scenarios, borrowers, sectors/regions contribute most to large losses?
PortfolioStudio’s reverse stress testing module utilizes simulation results (including portfolio loss, tail risk contributions, and GCorr systematic and macroeconomic factor realizations) to:
- Identify macroeconomic scenarios corresponding to a given level of portfolio loss or credit earnings
- Identify sectors and borrowers contributing most to such portfolio loss or credit earnings
- Reveal and plan for hidden vulnerabilities in the portfolio
- Benchmark against regulatory or other internal stressed scenarios
- Select macroeconomic variables for stress testing

Capital Planning: What actions will be taken to maintain capital adequacy as stress scenarios unfold?
Previously described loss distribution, stress testing, and reverse stress testing results from PortfolioStudio can be used to:
- Project capital demand and capital supply and assess capital adequacy under stress scenarios
- Plan and determine management actions (e.g. capital increase or risk/exposure reduction) that will be taken to prevent and to recover from possible capital deficiencies, if and as stress scenarios unfold
- Use such capital planning as part of internal capital adequacy assessment process and discussion with regulators, supervisors, and stakeholders.
Risk Appetite: What are the target levels (risk appetite) and limits (risk tolerances) for risk taking?
Prior sections describe how PortfolioStudio can be used to measure portfolio risk (loss distribution, volatility, quantile, etc.) and perform stress testing and reverse stress testing to assess and ensure capital adequacy. Portfolio risk and capital adequacy assessment results and metrics from PortfolioStudio can then be used to estimate capital demand and supply and compare them with market opportunity and risk strategy to inform and determine:
- Risk capacity, i.e., the maximum amount of risk an institution can support in pursuit of its business objectives
- Risk appetite, i.e., the target amount or range of risk an institution is willing to accept in pursuit of its business objectives; risk appetite is lower than risk capacity to allow for a safety margin (example: risk appetite to have AA S&P rating and CET1/EC of 250%)
- Risk tolerance and risk limits, i.e., boundaries of risk taking within which an institution is willing to operate; risk appetite is articulated more qualitatively and at aggregate level, while risk tolerances and limits are more quantitative and granular, e.g. borrower and segment limits (example of segment risk limit: automotive segment expected loss under CCAR adverse scenario shall not exceed 20% of total portfolio’s expected loss under CCAR adverse scenario)
This section describes how PortfolioStudio can be used to measure portfolio risk, assess and ensure capital adequacy, and thereby secure regulatory approval, favorable credit rating, and stakeholder confidence — not just from the normative (i.e., regulatory or accounting) perspective but also from internal economic perspective. In the next section, we describe the next key step in increasing portfolio return/risk.
3. Quantifying Each Exposure’s Incremental Impact on Portfolio Risk
Having measured portfolio risk and assessed and ensured capital adequacy, as described in Section 2, the institution can then focus on increasing portfolio return/risk, which naturally and practically can only be done by taking incremental (marginal) actions on a select few exposures or borrowers at a time. Selecting which exposures to increase or decrease requires calculating each exposure’s marginal impact on portfolio return/risk (defined as the increase in portfolio return/risk for a dollar more of that exposure), and then increasing those with the most favorable marginal impact on portfolio return/risk and decreasing those with the least favorable marginal impact on portfolio return/risk.
An exposure’s marginal impact on portfolio return/risk:
- Enables continual improvement of the portfolio from current state towards the optimal state (maximum return/risk), even as the optimal state changes in time as portfolio characteristics change;
- Transcends imitations and conflicts of siloed measures, e.g. a return/risk measure calculated based on exposure’s impact on a business line (sub-portfolio) may increase return/risk for that business line, but actually decrease return/risk for the overall institution (portfolio);
- Is the most practical, actionable, and optimal measure for selecting which exposures to increase or decrease in order to continually increase portfolio return/risk.
While a tail measure of portfolio risk such as 99.9 percentile loss (i.e., EC or CVaR) focuses on extremely large but rare losses and is used to assess capital adequacy, shareholders are more focused on measuring and minimizing loss volatility (i.e., standard deviation of losses at future horizon), accounting for the full range of losses (small, medium, large, and extremely large) together with their respective probabilities. In this document, an exposure’s marginal impact on portfolio tail risk (e.g. EC or a user-specified probability interval (e.g. 99.9 +/- 0.1 percentile) of the loss distribution) is termed “Tail Risk Contribution,” whereas, an exposure’s marginal impact on portfolio standard deviation (volatility) is termed “Risk Contribution”. PortfolioStudio calculates and reports both: Risk Contributions and Tail Risk Contributions.
Risk Contribution: What is the increase in portfolio risk for a $1 increase in exposure (notional)?
Exposure’s Risk Contribution (“RCi”), defined as the increase in portfolio risk (i.e., standard deviation of portfolio value at horizon) for a $1 increase in that exposure (notional), can be shown to equal the exposure’s standalone risk per unit notional, i.e., standard deviation of exposure value at horizon per unit notional (aka “unexpected loss” or “ULi”), multiplied by the correlation between exposure value and portfolio value at horizon (“CORRi,p”).

Only the correlated portion of the exposure’s standalone risk (ULi) contributes to and impacts the portfolio risk; the remaining portion of ULi, being uncorrelated with the portfolio, is diversified away. Exposure value’s correlation with portfolio value (CORRi,p), and, resultantly, exposure’s Risk Contribution (RCi), both increase as any of the following increase, all else equal:
- Exposure’s size, i.e., notional
- Exposure’s unexpected loss (ULi), i.e., standalone risk (standard deviation of exposure value at horizon) per unit notional; note: ULi generally increases as exposure’s PD, LGD, and maturity increase
- Exposure’s R-squared, i.e., % of borrower’s asset value risk that is systematic
- Correlation between sector and region of the exposure with those of the portfolio
PortfolioStudio calculates each exposure’s standalone risk (ULi) using its PD, LGD, maturity, etc., and then calculates portfolio risk measures (including ULp and EC) and instrument risk measures (including CORRi,p and RCi) using bottom-up, exposure-level, GCorr-based correlated simulation, taking into account each exposure’s notional, standalone risk per unit notional (driven mostly by PD, LGD, and maturity), as well as correlation with other exposures in the portfolio, regardless of the source of correlation or risk concentration, e.g. borrower, sector, or region, thus eliminating the need for any concentration add-on (relative to an assumed benchmark for a supposedly well-diversified portfolio). Exposure-level Risk Contributions can then be appropriately weighted and averaged across borrowers or sub-portfolios (or segments) to calculate borrower- or segment-level Risk Contributions.
Risk Concentrations: Which borrowers, sectors, and regions impact portfolio risk the most?
Risk Contribution (RC), the increase in portfolio risk impact for a $1 increase in current exposure (notional), can be used to decide where to add/reduce the next $ of exposure, identify risk concentrations and exposures (or sectors) that could cause large losses in a portfolio, and decide where to add/reduce exposure to increase diversification and reduce risk concentration and portfolio risk.
PortfolioStudio outputs RC together with PD, LGD, maturity, standalone risk (ULi), R-squared, notional, weight (notional as % of portfolio notional), and correlation with portfolio (CORRi,p) (collectively “risk drivers”) for each exposure and segment and can be used to measure, manage, and price risk and take incremental (marginal) actions to reduce risk concentrations and increase portfolio return/risk, as discussed in later sections. The following figures list RC and risk drivers for the top 15 borrowers and sectors ranked by RC. PortfolioStudio generates them in order to facilitate monitoring and analysis of risk concentrations, including borrower (name) and sector concentration, as shown below via illustrative examples for an example portfolio.


Risk Attribution: Which factors cause and explain exposure’s Risk Contribution level?
Users often want to understand why an exposure’s Risk Contribution (RC) is higher or lower and what drives the changes. Users can use PortfolioStudio outputs to better understand, communicate, and act upon the reported risk measures for any exposure via:
- An annotated flowchart (see Figure 7) relating the inputs and risk drivers to intermediate and final risk outputs and showing their levels.
- A table (see Figure 8) comparing the risk drivers and outputs of the chosen exposure with those of the relevant sector, geography, segment, and portfolio.
- An automated commentary (see Figure 8) describing the dynamics in simple business terms.


To review, PortfolioStudio can be used to (i) calculate each exposure’s marginal impact on portfolio risk, (ii) identify sources of risk concentration and diversification, and (iii) better understand, communicate, and act upon the reported risk measures for any exposure, borrower, or segment. We now turn to the next key step in increasing portfolio return/risk.
4. Setting Limits to Prevent Excessive Risk Concentrations
Exposure- and segment-level marginal return/risk measures, calculated as expected return divided by Risk Contribution (RC), can be used not only to increase portfolio return/risk via asset selection, as described in Section 5, but also to monitor marginal return/risk and prevent excessive risk concentrations by rejecting deals or reducing exposures that have high RC and low marginal return/risk and that would decrease portfolio return/risk. Doing so requires reliable tools and metrics and unflinching discipline.
As a practical, conservative alternative and/or supplementary approach, and as a backstop to the aforementioned marginal return/risk-based monitoring and limit setting, most institutions also calculate and enforce absolute notional limits in order to prevent excessive risk concentrations and to keep risk levels consistent with risk appetite and risk strategy. Limits based on notional exposure are a good start, but they have significant limitations:
- They do not account for borrower or segment-specific risk.
- They do not account for the impact of borrower’s or segment’s correlation and concentration relative to the portfolio.
- They are more qualitative and subjective, and thus prone to subjective bias, and not easily defendable.
- They involve a manual process and are difficult to update frequently.
- They are not dynamic; they generally remain fixed despite changes to portfolio holdings and profile.
PortfolioStudio overcomes these limitations by using a quantitative and risk-sensitive approach. It uses analytic formulas, together with Monte Carlo simulation results, to calculate the relationship (“Risk vs. Notional Curve”) between a borrower’s or segment’s “Notional Weight” and the corresponding “Risk Contribution Weight” for varying levels of borrower’s or segment’s Notional Weight, assuming no change to the rest of portfolio. Risk Contribution Weight is defined as a borrower’s or segment’s notional-weighted Risk Contribution, as a fraction of the sum of notional-weighted Risk Contribution of all exposures in the portfolio.
Segment Limits: What is the notional limit given a limit on each segment’s Risk Contribution?
Given a set of user-specified Segment Risk Contribution Weight Limits and using the aforementioned Risk vs. Notional Curve, PortfolioStudio calculates the corresponding set of “Risk-Adjusted Notional Limits” for each segment, assuming no change to the rest of the portfolio. Users can specify the Segment Risk Contribution Weight Limits to be the same or different across segments. In addition to the GCorr industry and country segmentations, PortfolioStudio allows for up to four user-defined segmentations for segment-level reporting, what-if analysis, stress testing, optimization, and limit setting.


Borrower Limits: What is the notional limit given a limit on each borrower’s Risk Contribution?
Using a similar approach as that for limit setting for segments described above, PortfolioStudio can also calculate Risk-Adjusted Notional Limits for the top-20 borrowers ranked by notional-weighted Risk Contribution.
To review, this section describes how PortfolioStudio can be used to set Risk-Adjusted Notional Limits given a user-specified limit on segment’s or borrower’s Risk Contribution Weight. This quantitative risk-sensitive limit setting can be performed periodically using PortfolioStudio to reflect changes to portfolio holdings and their risk characteristics, as well as changes to risk appetite. In the next section, we describe the next key step in increasing portfolio return/risk.
5. Increasing/Decreasing Credit Exposure to Increase Portfolio Return/Risk
Prior sections focused on risk, i.e., the denominator of return/risk ratio. In this section and the next, we describe how PortfolioStudio can be used to calculate and increase portfolio return/risk and stakeholder value. We also discuss relevant best practices and ways to overcome implementation challenges.
Asset Selection: Which exposures should be increased/decreased to increase portfolio return/risk?
We can show that exposure’s (standalone) expected return equals that exposure’s marginal contribution to portfolio expected return, regardless of exposure notional and portfolio characteristics. Thus, an exposure’s Sharpe Ratio, defined as “expected return / Risk Contribution,” is a marginal measure quantifying exposure’s marginal impact on portfolio return/risk and can be used to decide which exposures to increase/decrease in order to increase portfolio return/risk. Portfolio return/risk can be increased by increasing exposures with Sharpe Ratios higher than the portfolio Sharpe Ratio and decreasing exposures with Sharpe Ratios lower than portfolio Sharpe Ratio. Portfolio Sharpe Ratio changes with the portfolio, and it can be used as a dynamic hurdle rate, without the need to compare exposure’s Sharpe Ratio with an exogenously imposed hurdle rate, which often is static and not portfolio-sensitive, despite changes in the portfolio. Furthermore, using an exogenously imposed hurdle rate is superfluous (relative to using portfolio Sharpe Ratio as the hurdle rate) and may lead to asset selection that can actually decrease the portfolio’s Sharpe Ratio.3
PortfolioStudio calculates and reports each exposure’s and segment’s expected return (or credit earnings based on CECL or IFRS 9) and Sharpe Ratio, together with Risk Contribution, correlation with portfolio, and other risk measures discussed previously, and which can be used to selectively increase/decrease exposures and increase portfolio return/risk. If regulatory or capital structure requirements appear to constrain the said asset selection, the institution can overcome such apparent constraints by scaling down (decreasing) all current exposures in the portfolio, or by raising additional capital at market rates. In either case, and to the extent there is no gain/loss relative to market price, the institution can continue to increase portfolio return/risk by rebalancing portfolio using aforesaid marginal return/risk contributions, while simultaneously and independently meeting regulatory and/or economic capital requirements.
Optimal Allocation to Segments: Which segments should be grown/reduced and by how much, in order to maximize portfolio return/risk (Sharpe Ratio)?
Consistent with the Sharpe Ratio-based asset selection discussed previously, and utilizing segment level results from Monte Carlo simulation, PortfolioStudio’s Deal Allocation application quickly calculates segment level optimal investment amounts that maximize portfolio return/risk, given user-specified investment budget and segment level buy/sell limits. Users can choose to optimize the portfolio via any of the four strategies:
- Mean-Variance: minimize portfolio return volatility while meeting a target expected return
- Minimum Volatility: minimize portfolio return volatility across all expected return levels
- Maximum Sharpe Ratio: maximize portfolio Sharpe Ratio, i.e., expected return/return volatility
- Risk Parity: to the extent possible, equalize each segment’s notional-weighted Risk Contribution
Each of these optimization strategies can be performed on the portfolio with or without new deals. Each strategy can also be performed under user-specified stress scenarios. If regulatory or capital structure requirements appear to constrain the said optimization, the institution can overcome such apparent constraints by scaling down (decreasing) all current exposures in a portfolio, or by raising additional capital at market rates. In either case, and to the extent there is no gain/loss relative to market price, the institution can continue to increase portfolio return/risk by rebalancing portfolio using aforesaid marginal return/risk contributions, while simultaneously and independently meeting regulatory and/or economic capital requirements.


PortfolioStudio also calculates and plots the efficient frontier, showing the full range of possible return and risk levels for the portfolio, including the point (shown as a red cross in Figure 16) corresponding to the maximum Sharpe Ratio.

To review, this section describes how PortfolioStudio can be used to increase portfolio return/risk by Sharpe Ratio-based asset selection and segment-level portfolio optimization. The following section describes the next key step in increasing portfolio return/risk.
6. Pricing and Sizing New Deals to Increase Portfolio Return/Risk
The prior section focused on how PortfolioStudio can be used to decide what to buy, sell, or hold to increase portfolio return/risk. What is equally important is to do so at the right price and with the correct size and terms. Sizing and structuring deals appropriately become even more important when the institution is a price-taker rather than a price-setter. PortfolioStudio’s deal pricing module enables institutions to quickly calculate return and risk measures for a new deal or a basket of new deals, considering the deal’s standalone risk (driven mostly by PD, LGD, and maturity), as well as portfolio correlation and risk concentrations. The module has an intuitive user interface that enables deal makers to conveniently specify borrower characteristics (e.g. notional, PD, LGD, etc.) and deal terms and conditions (e.g. coupon, maturity, etc.). Users can also choose to incorporate the impact of CECL and IFRS 9 provisions or macroeconomic/stress scenarios into deal pricing.
Risk-Based Pricing: What is the deal’s Risk Contribution and Sharpe Ratio, i.e., deal’s impact on portfolio return/risk, taking account of deal’s notional, standalone risk, and correlation with portfolio?
Leveraging key metrics from the original portfolio analysis, PortfolioStudio can quickly (within seconds and at the point of origination) calculate marginal return and risk statistics, including expected return (or credit earnings), Risk Contribution (RC), Sharpe Ratio, and incremental portfolio economic capital for new deals. Alternately, given RC for a deal, one can calculate the pricing required to meet or exceed portfolio Sharpe Ratio or any user-specified hurdle rate. Users can also calculate return/risk measures by substituting PortfolioStudio’s expected return (numerator) with a user-specified expected return, which should be a marginal measure, in order to remain consistent with Risk Contribution (denominator), which is marginal.

Sections 2−6 describe how PortfolioStudio can be used to efficiently perform the five key steps to increasing portfolio return/risk. Section 7 describes additional PortfolioStudio functionality.
7. PortfolioStudio: Additional Functionality
What-If Analysis
PortfolioStudio’s what-if analysis application allows users to modify inputs, e.g. by scaling or shifting PDs, for certain or all segments in a portfolio and examine the impact on portfolio risk statistics. It provides a convenient way for users to perform sensitivity analysis without creating and loading new portfolios.


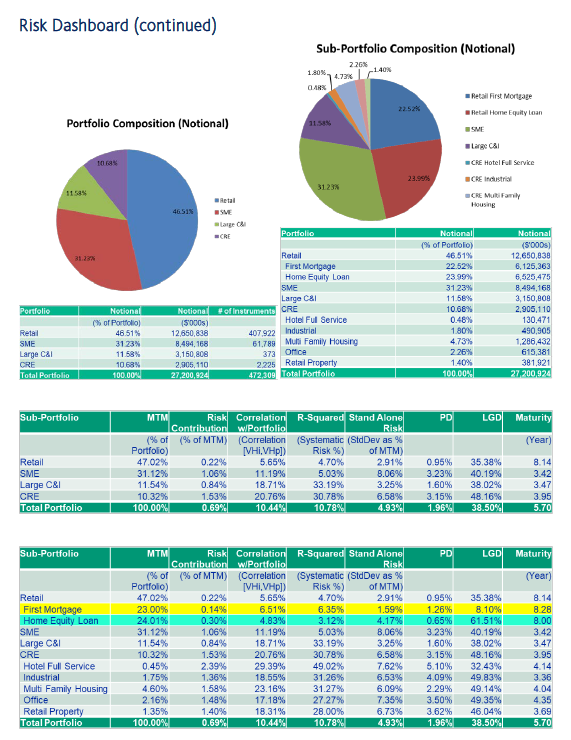
PortfolioStudio’s Risk Dashboard provides an executive view of all relevant risk measures on one screen. Users can choose from pre-defined templates with the ability to move, select, or remove items. Clicking any item on the Risk Dashboard launches a detailed view or corresponding module, most of which have been described previously in this document.


PortfolioStudio’s spread-risk module allows for simultaneously modeling of credit risk and spread risk and facilitates spread-risk decomposition.


8. Summary
Institutions holding credit portfolios can increase stakeholder value by increasing return/risk, while also ensuring capital adequacy and regulatory compliance. This process, for the most part, requires five key steps:
- Measuring portfolio risk and ensuring capital adequacy
- Quantifying each exposure’s marginal impact on portfolio risk
- Setting limits to prevent excessive risk concentrations
- Increasing/decreasing credit exposure to increase portfolio return/risk
- Pricing and sizing new deals to increase portfolio return/risk
Designed with the business user in mind, and as described in this document, Moody’s Analytics PortfolioStudio is an agile efficient solution that helps institutions perform these five key steps and increase portfolio return/risk.
1 PortfolioStudio is designed to explicitly analyze a broad range of asset classes (public and private firms, CRE, retail, sovereign, and project finance) and credit instruments (term loans, revolving lines of credit, bonds, CDS, and structured products). GCorr is a multi-factor correlation model — consisting of close to 1,000 geographical, sectoral, and national and regional macroeconomic factors — is updated and validated annually and is based on a long time series of empirical and granular data capturing intra- and inter-asset class correlations. For more information, see “An Overview of Modeling Credit Portfolios” by Levy (2013); “Modeling Credit Correlations: An Overview of the Moody’s Analytics GCorr Model” by Huang, Lanfranconi, Patel, and Pospisil (2012); and “Portfolio Management of Default Risk” by Kealhofer and Bohn (2001).
2 The same simulation is also used to calculate exposure and segment-level risk metrics, including marginal risk contributions and correlation with portfolio, described later in this document.
3 For example, an exposure “i” with Sharpe Ratio (SRi) greater than an exogenously imposed hurdle rate (HR) but less than portfolio Sharpe Ratio (SRp), i.e. HR < SRi < SRp, will pass the hurdle but will actually decrease portfolio Sharpe Ratio. Similarly, an exposure “i” with Sharpe Ratio (SRi) less than an exogenously imposed hurdle rate (HR) but greater than portfolio Sharpe Ratio (SRp), i.e. HR > SRi > SRp, will fail the hurdle but will actually increase portfolio Sharpe Ratio.
Bohn, Jeffery and Stephen Kealhofer, “Portfolio Management of Default Risk.” Moody’s KMV Whitepaper, 2001.
Huang, Jimmy, Mariano Lanfranconi, Nihil Patel, and Libor Pospisil, “Modeling Credit Correlations: An Overview of the Moody’s Analytics GCorr Model.” Moody’s Analytics Whitepaper, 2012.
Kaplin, Andrew, Amnon Levy, Nihil Patel, and Libor Pospisil “Applications of GCorr™ Macro: Risk Integration, Stress Testing, and Reverse Stress Testing.” Moody’s Analytics Whitepaper, 2014.
Kaplin, Andrew, Amnon Levy, Qiang Meng, and Libor Pospisil “Quantifying Risk Appetite in Limit Setting.” Moody’s Analytics Whitepaper, 2015.
Levy, Amnon, “An Overview of Modeling Credit Portfolios.” Moody’s Analytics Whitepaper, 2013.
Levy, Amnon, “Nonbank players are ready for CECL — are banks?” American Banker, August 15, 2019.
Levy, Amnon and Jing Zhang, “Measuring and Managing the Impact of IFRS 9 and CECL Requirements on Dynamics in Allowance, Earnings, and Bank Capital.” Moody’s Analytics Whitepaper, 2018.
Levy, Amnon, Xuan Liang, and Pierre Xu, “Earnings Volatility, Share Price Performance, and Credit Portfolio Management Under CECL and IFRS 9.” Moody’s Analytics Whitepaper, 2019.


