Summary
Infrastructure plays a major role in our daily lives and COVID-19 is affecting our infrastructure, specifically transportation usage. With global recommendations for social distancing, fewer people are traveling for business or commuting to/from work and school. Airports, trains, subways, buses, and roads—which include bridges and tunnels—are less crowded. This is Part 1 of a two-part article tracking the credit performance of transportation project finance loans before and during COVID-19.
Moody’s Analytics Data Alliance leads a Project Finance loan default and recovery data consortium that contains data from 1983 through 2019. The data was used to analyze the credit performance of the subindustries of Project Finance.
For the analysis we calculated historical cumulative default rates, using the Basel definition of default, for project finance bank loans from the data consortium to compare to Moody’s Investors Service (MIS) corporate rated debt (see the Glossary for definitions). We also calculated recovery performance from the data consortium to compare to MIS Ultimate Recovery Database. Here are some key findings from this analysis:
- The cumulative default rates for infrastructure and transportation loans are consistent with low investment-grade corporate loans.
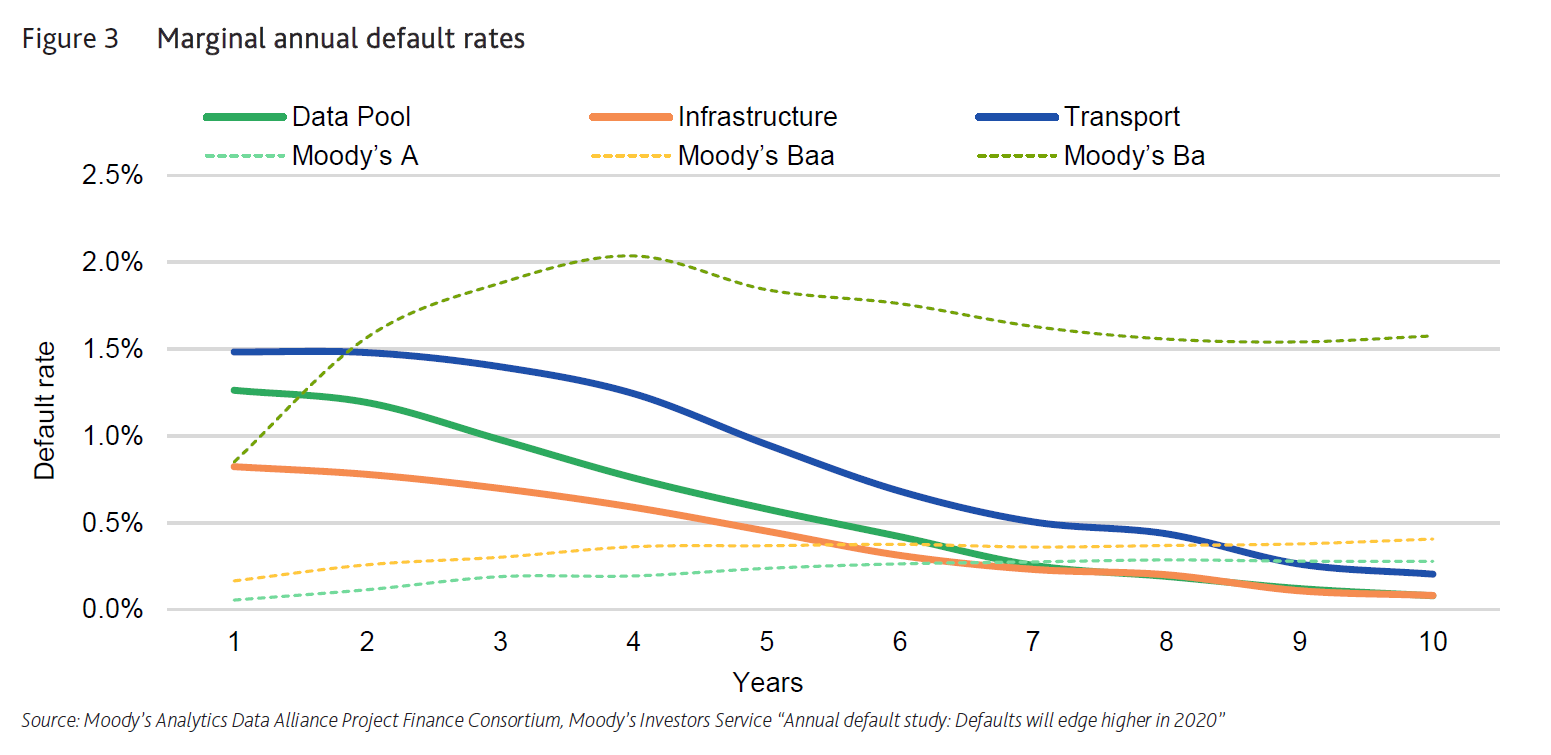
- Marginal default rates for infrastructure loans perform like A-rated debt by year 7 and transportation loans perform like A-rated debt by year 9.
- Ultimate recovery rates for infrastructure loans averaged 76.6% compared to 79.1% for the consortium dataset. The transportation loans averaged 83.0%, which are similar to the recoveries for senior secured corporate loans.
- Infrastructure loans default on average 5.1 years after origination compared to the data pool with an average of 4.2 years. Transportation defaulted on average 5.9 years after origination
Overview
Our 2019 consortium data pool contains 9,332 projects with 2,706 infrastructure projects that include 1,222 transportation projects. 653 out of the 1,222 projects have loans that are outstanding with maturities after 2019. Those 653 outstanding loans will be the focus of Part 2 of these articles after we receive the 2020 data from our consortium members, which may contain project defaults caused by COVID-19.
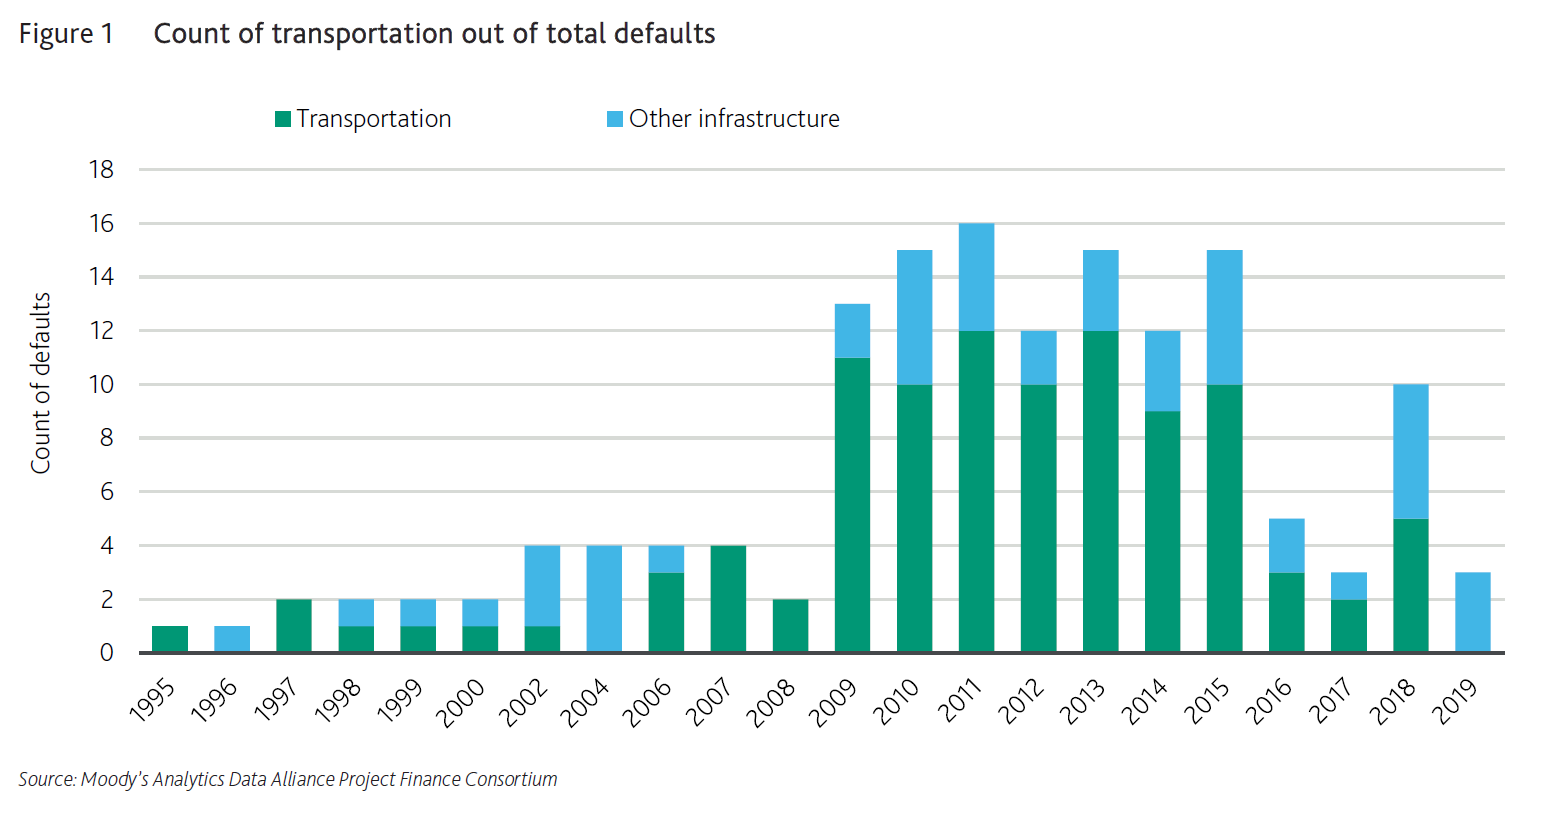
Project finance is a low-default industry and even more so with infrastructure. However, recently, transportation experienced periods of higher defaults following the 2008 economic crisis and again in 2013 to 2015 with several underutilized Western European and North American toll roads and port defaults. 2019 was the first year since 2005 with no transportation defaults.
While people are working/schooling from home, transportation usage is down since the COVID-19 pandemic began. We would like to determine if the decreased usage from COVID-19 restrictions is directly correlated to potential new defaults during 2020. We also want to see how this affects the cumulative and marginal default rates. At the end of 2019, the 653 outstanding loans have an average of 6.7 years since origination. Approximately 15% of the projects are under construction, where usage is not measurable yet.
Project finance defaults are idiosyncratic but there are some periods of defaults that follow industry trends. We found more evidence of that in the power and oil & gas industries than with infrastructure. Also, infrastructure defaults have not been correlated to major pandemics such as SARS in 2002, the H1N1 swine flu in 2009–2010, and the Zika Virus epidemic from 2015 to the present day.
Infrastructure and transportation debt performance
Figure 1 compares the contribution of transportation defaults and other infrastructure defaults, by project count. Project loan defaults do not occur immediately after origination. Infrastructure loans default on average 5.1 years after origination, which is almost a full year longer than the overall data pool average of 4.2 years. Transportation loans defaulted on average 5.9 years after origination, which is more than 1.7 years longer than the 4.2 years after origination for infrastructure projects. This is significant because longer time to default translates into higher cumulative default rates and as mentioned, the weighted average time outstanding since origination on the 653 loans is 6.7 years. This suggests that most transportation defaults occur during operations and approximately 80% of the defaults were on operational projects.

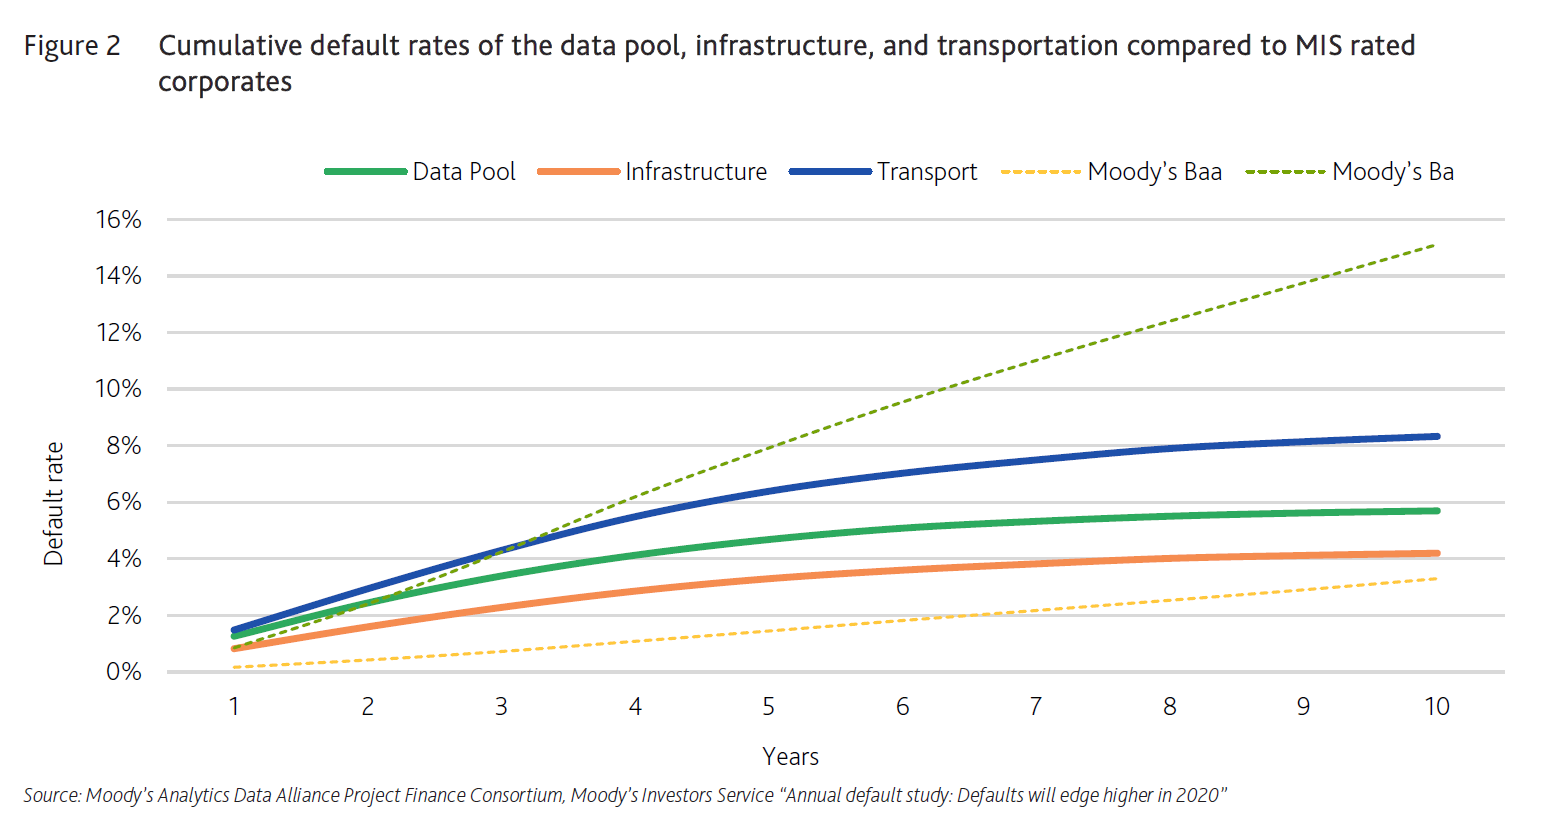
The 10-year cumulative default rate for the data pool of 9,332 loans with 611 defaults was 5.7% and for the 2,706 infrastructure loans with 147 defaults was 4.2%. The 1,222 transportation projects with 100 defaults have a 10-year cumulative default rate of 8.33%, which is higher than both the data pool and infrastructure. Figure 2 displays the cumulative default rates for the data pool, infrastructure, and transportation compared to MIS corporate rated debt.

The cumulative default rates for the data pool, infrastructure, and transportation lie squarely between MIS corporate rated Ba and Baa-rated debt. Figure 2 illustrates how the project finance loan curves began to flatten out by year 7. The marginal annual default rates in Figure 3 show that the data pool and infrastructure loans perform similarly to mis A-rated debt by year 7, which is consistent with Figure 3, and transportation projects perform similarly to MIS A-rated debt by year 9. This figure also shows how the risk of default decreases over time for project finance loans, which is different than for corporate debt where risk continues to increase over time, although at decreasing rates.

Default severity is determined by the loan recovery. The overall average recovery for 306 project finance loans in the data pool that emerged from default is 79.1%, and the average recovery for 53 infrastructure projects was 76.6%. The 32 transportation loans had an average recovery of 78.8%, which is 0.3% lower than the data pool and 2.1% higher than overall infrastructure recoveries. The corporate loan data for all loans have an average recovery of 80.0% and senior secured loans average recovery was 85.2%. Interestingly, project finance loan recoveries have been increasing for the past three years with an average recovery of 100% in 2019; however, corporate loan recoveries were lower in 2019 at 70.2%1
Expected loss is the product of the probability of default (PD) and the loss given default (LGD). The overall data pool has a 10-year cumulative default rate of 5.70% with an average recovery of 79.1%, and the 10-year expected loss is 1.2%. For infrastructure, the 10-year cumulative default rate is 4.20% with an average recovery of 78.8%, and the 10-year expected loss was 1.0%. For transportation the 10-year cumulative default rate was 8.33% with an average recovery of 78.8%, and the 10-year expected loss was 1.8%. By comparison, the expected loss for all Baa loans was 0.7% and 3.0% for all Ba loans.
This shows us that notwithstanding the increases in infrastructure defaults between 2009 and 2015 shown in Figure 1, infrastructure loans perform better than the data pool of project finance loans. Transportation performance has a higher default rate than the data pool, and average recoveries are the same as the data pool. Expected loss for transportation projects is between the expected loss for MIS rated Ba and Baa-rated loans.
Project finance is a well-managed asset class. It is possible that although usage was down during 2020, the projects can withstand periods of reduced cash flow with enough cash available to service their debt. Project finance deals are highly structured and protected by financial covenants and offtake contracts offering protection to the lenders. Part 2 of this article will address our observations of the 2020 consortium data.
1 Moody’s Investors Service “Annual default study: Defaults will edge higher in 2020.”


