The coronavirus (COVID-19) continues to pose unprecedented impacts on the commercial real estate (CRE) industry.
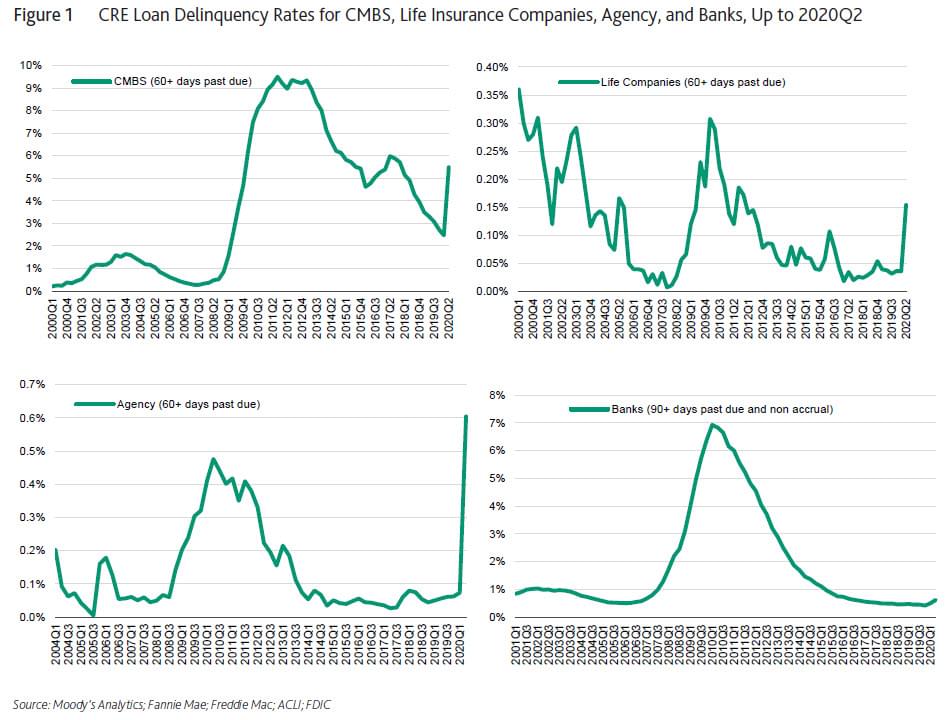
Given the public health measures initiated to help combat the virus’ spread, the CRE industry continues to face tremendous challenges. In 2020Q2, we observed a huge spike in elevated delinquency rates in the CMBS portfolio. In contrast, balance sheet lenders, banks, life insurance companies, and agencies continue to report very mild delinquency rates, despite the fact that all sectors reported noticeably increased nonperforming loans 2019Q4−2020Q2.
Forbearance and loan modification appear to be prevailing practice in dealing with COVID-19-related troubled loans across the CRE industry, especially for the balance sheet lenders, which have a lot more flexibility than their CMBS counterparts. These helped drive lower delinquency rates, as many borrowers are no longer behind on mortgage payments under the modified loan terms. Despite all efforts, hotel and retail sectors have experienced the largest percentage of delinquent and modified loans.
Furthermore, with forbearance and modification activities underway, it is very challenging to get an accurate reading of overall CRE loan performance, so the exact severity of the hardship that borrowers currently face remains unclear. While relieving temporary pains, the longer-term question remains how many loans may still fail. To handle this critical issue under the current environment, we must keep monitoring both delinquency and modification rates across the industry and continually re-assess the associated credit risk as the situation evolves.
1. Introduction
In 2020, the commercial real estate (CRE) industry has been affected more immediately and more profoundly by COVID-19 than by previous economic downturns. Due to the still-elevated unemployment rate and the public health measures used to combat the virus’ spread, the CRE industry faces tremendous challenges currently and going forward, impacted by reduced rental incomes and high vacancy rates.
This study examines the recent performance of the commercial real estate loan portfolios of the four largest lender groups: commercial banks, insurance companies, agencies, and CMBS. For CMBS, we focus on two deal types, conduit and large loans. Due to different reporting standards, we measure delinquency rates as follows for different lender portfolios:
- Commercial banks’ delinquency rate covers loans 90+ days delinquent and nonaccrual. The data is downloaded from the Federal Deposit Insurance Corporation (FDIC).
- Life insurance companies’ delinquency rate covers loans 60+ days delinquent, including those in foreclosure. The quarterly data comes from the American Council of Life Insurers (ACLI).
- The Agency portfolio’s delinquency rate covers loans 60+ days delinquent, including those in foreclosure. The data comes from Fannie Mae and Freddie Mac and is for multifamily loans only.
- CMBS delinquency rate covers 60+ days delinquent loans including those in foreclosure, and real estate owned (REO). It is calculated using data from Moody’s Analytics.
There also exist different reporting lags, as CMBS typically has more timely reporting on a monthly basis, whereas balance sheet lenders follow a quarterly schedule. For example, while some may choose to report more frequently, commercial banks are only required to file Call Reports on a quarterly basis, and it takes about two months after quarter-end before the data for all banks is consolidated into a usable data file format and downloadable through the FDIC website. To maintain consistency and to conduct a meaningful apples-to-apples comparison, we decide to evaluate loan performance at the end of the second quarter, when data is available for all lender groups. For more updated delinquency information regarding the CMBS sector, please refer to the monthly report, “CMBS-US: Moody’s DQT,” published by Moody’s Investors Service.
2. Recent Delinquency Rate Trends
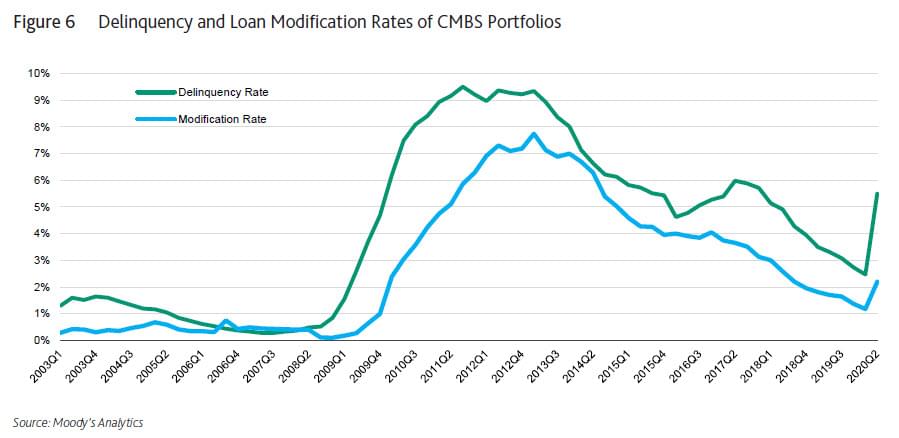
We next examine recent delinquency rate trends across the four major lender groups within the context of historical cycles to help better understand the COVID-19 pandemic’s impact. Figure 1 shows historical delinquency rates of CRE loans held by commercial banks, life insurance companies, agencies, and CMBS. Although delinquency rates are not directly comparable between lender groups due to differences in definition and portfolio composition, we see clearly discernable credit cycles corresponding to business cycles. During previous recessions, delinquency rates of all lender portfolios largely shared synchronized ebbs and flows, albeit at different levels. During the second quarter of 2020, the pandemic’s unprecedented impact has been most noticeably manifested by the high delinquency rates in the CMBS loan universe. The 5.5% observed rate observed is not only a 3% increase from the prior quarter, it also surpasses the level observed at the end of 2009, when the last recession had already technically ended. At this current pace, it is quite likely that CMBS delinquency rates will very soon reach the peak levels observed during the last financial crisis.
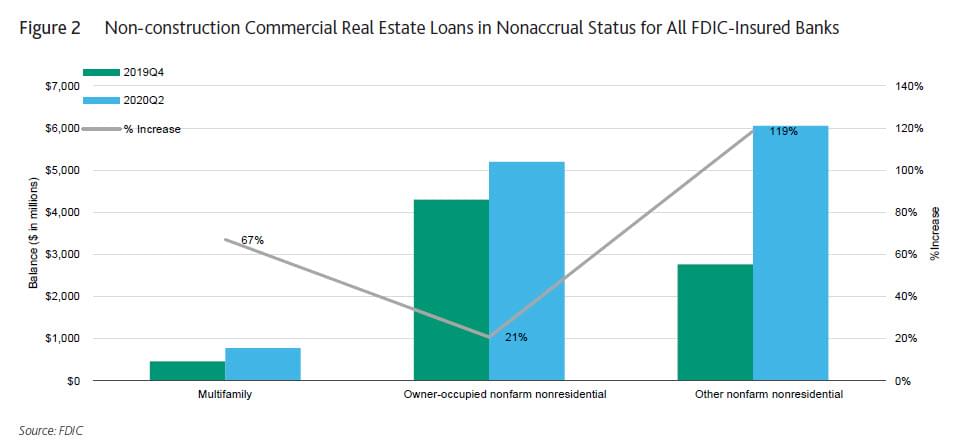
Many details regarding commercial banks’ CRE loan performance are included in their 2020Q2 Call Reports. It is worthwhile further examining the detailed statistics. Loans in nonaccrual status increased dramatically during Q2 from the pre-COVID period for those secured by multifamily properties and other nonfarm nonresidential properties.1 In particular, the nonaccrual amount for the “other nonfarm nonresidential” category has more than doubled, as loans secured by retail and hotel properties belong to this category. Compared to the CMBS delinquency rate, the nonaccrual rate of commercial banks’ loans remains rather low, likely reflecting the mortgage payment deferment and modification practice prevailing in the current environment for balance sheet lenders.
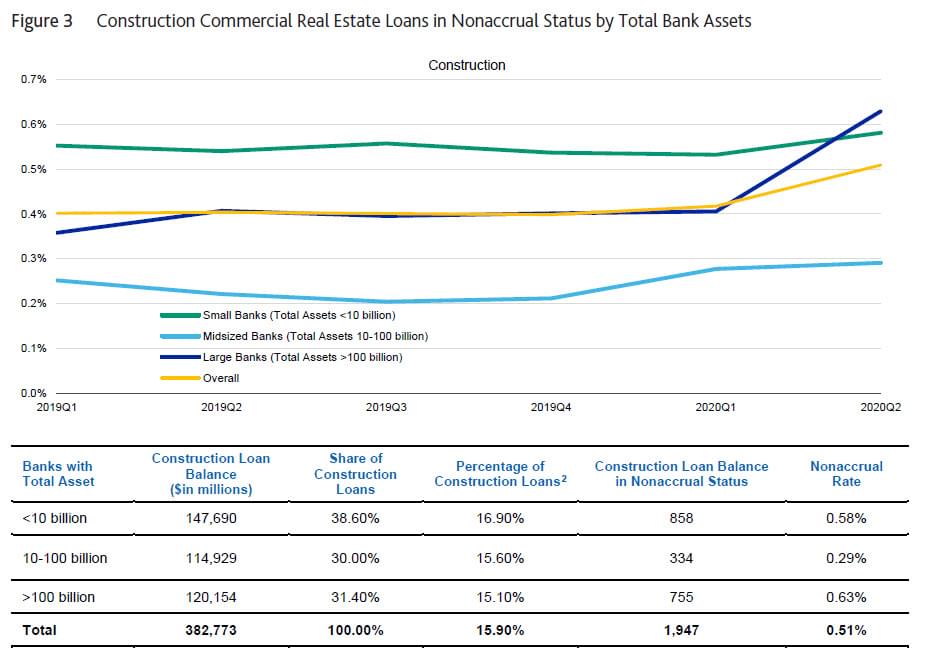
Construction loans are much riskier than permanent loans secured by stabilized properties. Delinquencies and defaults are closely tied to business cycles, as new construction tends to get delayed or even canceled during distressed economic environments. The COVID-19 pandemic poses unique challenges to construction projects. Various public health measures and guidelines, such as social distancing and disinfecting common areas and construction equipment, also hinder the progress of commercial construction projects. During 2020Q2, construction loans in nonaccrual status increased by approximately 50% for large banks with total assets of more than $100 billion. The nonaccrual rate of construction loans in small and midsized banks remained stable. Larger banks have been more active in financing large-scale commercial constructions, most of which are in populated metropolitan areas affected more by the pandemic. Overall, nonaccrual loans are still a very small portion of the construction portfolio when compared to previous recessions.
The CRE industry has been hammered by the pandemic, although the impact has not been felt evenly across different property types. The hospitality industry is undoubtedly among the hardest hit. Although domestic travel has resumed by a very limited degree, the most lucrative business travel, large events, and international tourism have not returned in the U.S. Retail is another victim, impacted by lockdowns, social-distancing measures, and the surging online economy. Not surprisingly, we see huge spikes in the delinquency rates for hotel and retail property types in the CMBS universe. Similarly, hotel and retail loans also post disproportionally larger shares of new delinquencies in life insurance companies’ portfolios. As shown in Figure 4, the delinquency rate increase of retail properties is more than that of the overall portfolio. In the CMBS market, the delinquency rate for loans secured by hotel properties is more than 1.5 times that secured by retail properties; whereas for life insurance companies’ portfolios, the delinquency rate for loans secured by hotel properties is more than five times that secured by retail properties.
Other major property types (multifamily apartment, office, and industrial), all reported much milder increases in delinquency rates. In fact, for the time being, these loans look quite resilient in terms of credit performance. Multifamily renters are certainly benefiting from various government relief programs, most importantly tax rebates and enhanced unemployment insurance benefits. Industrial properties, in particular the logistics and warehouse segments, which facilitate e-commerce, are also benefiting from the rapidly accelerated shift from physical retail to online shopping. While still facing significant challenges due to social distancing and remote working, the office sector has also likely benefited from various relief programs, including the Paycheck Protection Program (PPP), where part of the loans/grants can be used to make rental payments. Typical, multi-year leases probably helped shield office properties from taking an immediate hit as well. The pattern remains universal across all lender groups.
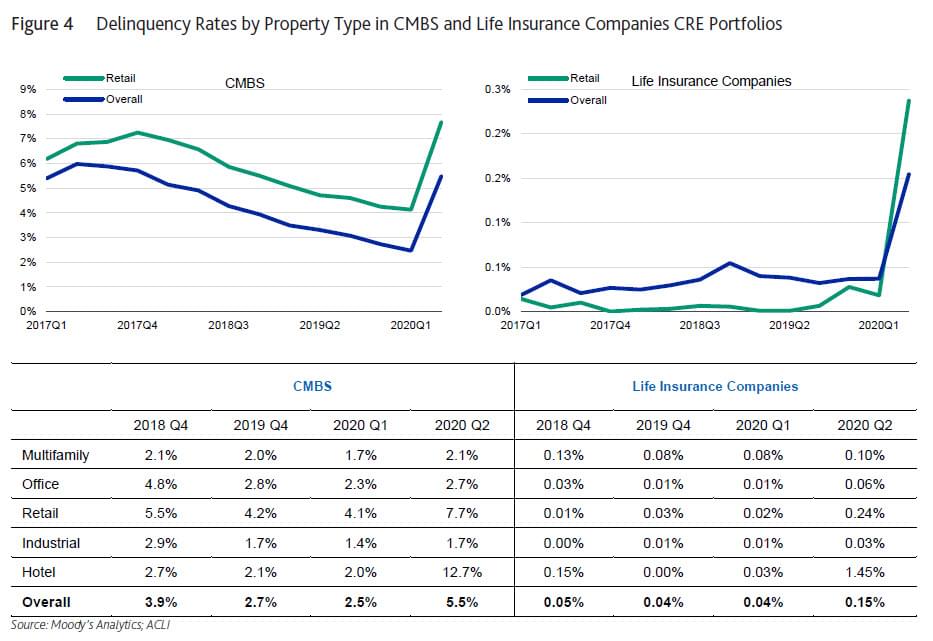
Holding the largest share of CRE loans, commercial banks are not required to report delinquency and nonaccrual statistics at the property type level in their Call Reports. In its most recent earnings release, Wells Fargo (WFC) disclosed its CRE loan book’s credit performance by property type. Compared to 2020Q1, the nonaccrual rate for loans secured by hotel properties doubled from 0.6% to 1.4% during the second quarter. The retail sector added a significant amount of nonaccrual loans, especially for shopping centers, whose nonaccrual rate was already high at 2.3% in Q1, and rose to 3.2% in Q2. We see a small increase in the amount of nonaccrual loans secured by office properties, while the nonaccrual rates of multifamily and industrial loans remain stable. The largest among all lenders, Wells Fargo’s CRE portfolio is representative enough to shed light on the loan performance for commercial banks in general. Overall, delinquency rates of loans secured by hotel and retail properties have ticked up, similar to other lenders’ portfolios.
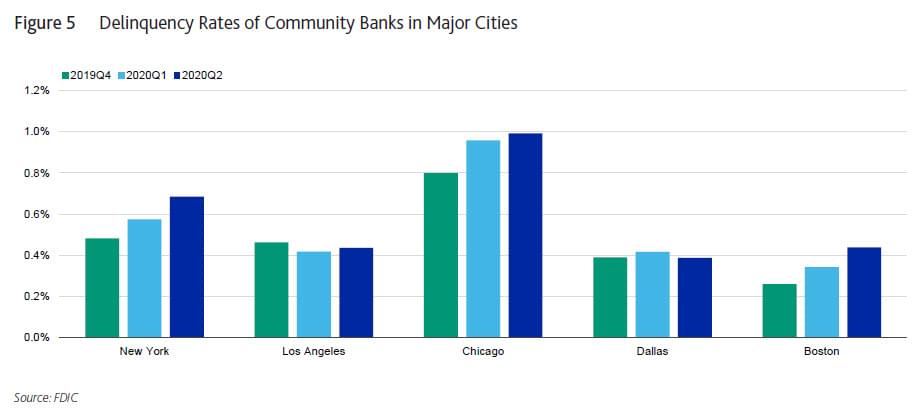
The pandemic’s impact on commercial properties has also varied by location. Looking at community bank3 delinquency rates, whose commercial lending businesses are concentrated in major cities, we notice the upward trend of delinquency rates for New York, Chicago, and Boston during the first half of 2020, whereas Los Angeles and Dallas show a stable percentage of loans in 90+ past due and nonaccrual status. This finding coincides with the different epidemiological paths of COVID-19 across different states, where confirmed COVID-19 cases in New York, Illinois, and Massachusetts peaked in April, while states in the South and West started to experience surges in June. The state-level delinquency rates appear to reflect these timing differences.
3. Forbearance, Payment Deferral, and Loan Modification Related to COVID-19
In the previous section, we observe that delinquency rates climbed to very high levels for CMBS loans, while all balance sheet lenders (commercial banks, life insurance companies, and agencies) continue to report very mild delinquency rates, despite all sectors reporting substantially increased nonperforming loans from 2019Q4−2020Q2. While we might attribute much of the differences to underlying portfolio composition and loan characteristics, we suspect that the low delinquency rates for the balance sheet lenders are also a result of more extensive forbearance and loan modification.
The CMBS market is governed by strict rules and protocols to help ensure the maximum integrity of CMBS bonds as an investment vehicle. The unfortunate side effect from the rigorous governing mechanism is the lack of flexibility for modifying CMBS loans, which obviously has a ripple effect on all stakeholders, most importantly investors of various tranches of different seniorities, as their financial claims could be affected by modified loan terms. From a procedural standpoint, CMBS loans must go through a special servicer to be considered for loan modification, including payment deferment. Many frustrated borrowers find it easier to miss mortgage payments first, which automatically triggers a transfer of the loan to a special servicer, which keeps the process going faster regarding potential loan modifications. Historically, modification rates lag behind delinquency rates in the CMBS universe. As shown in Figure 6, following the 2008−2009 financial crisis, the delinquency rate reached its peak in late 2011, while the modification rate reached its highest level a few quarters later. Given the current environment and that the delinquency rate continues to climb, we expect the modification rate to take off and catch up during the next few quarters.
It is a drastically different story for shares of loans in delinquent versus in modification for balance sheet lenders. Without having to navigate and negotiate with numerous stakeholders, balance sheet lenders are blessed with the flexibility of working directly with borrowers on deferrals and modifications once borrowers face difficulties making payments.
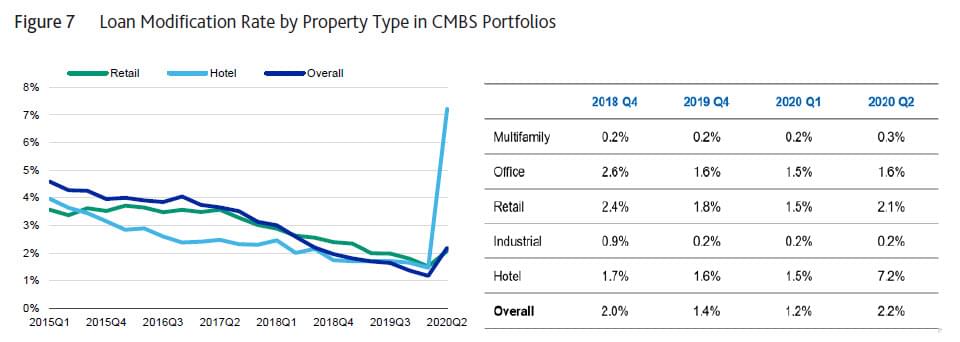
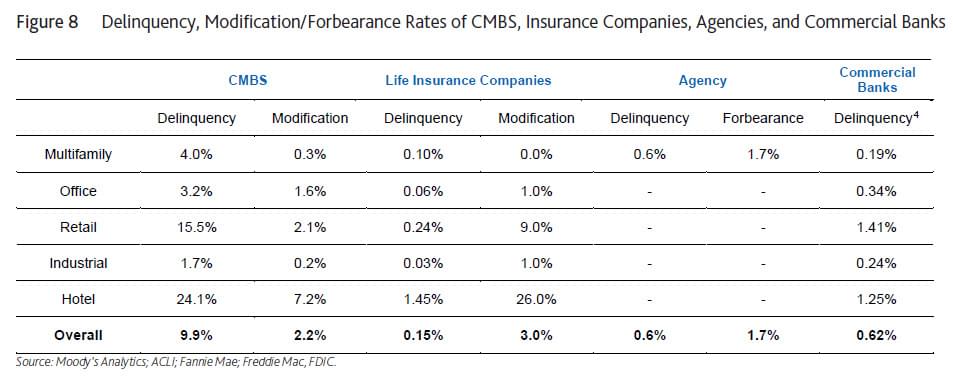
For life insurance companies, COVID-19-related modifications accounted for more than 3% of the total portfolio as of April 30, 2020, compared to a 0.2% delinquency rate. Retail property type accounted for more than 50% of all COVID-19 modifications with a 9% modification rate. Hotel property type had the highest rate of modifications among all property types, at about 26%. The higher modification rates of retail and hotel loans remain consistent with their higher delinquency rates compared to other property types.
On the agency side, both Fannie Mae and Freddie Mac implemented a series of relief plans beginning March 2020 that allow qualifying multifamily borrowers to defer mortgage payments. According to Fannie Mae and Freddie Mac’s 2020Q2 financial reports, their forbearance rates are 1.2% and 2.4%, respectively, based on unpaid principal balance (UPB), which adds up to a 1.7% forbearance rate for their combined multifamily portfolio. New York has the most forborne loans among all metro areas, based on UPB, which may be attributed to its being hardest hit by the coronavirus during the first quarter of the year.
Loans secured by hotel properties have the largest change in modification rate from pre-pandemic to 2020Q2 among all property types in CMBS portfolios. The retail modification rate has started rising as well. This finding is consistent with the surges in delinquency rates observed for the two property types. The share of modified loans for the multifamily, office, and Industrial property types remains stable as of the second quarter. However, we expect modification rates for loans secured by multifamily and office properties to increase in our baseline forecast, given the challenges they are facing amid the prolonged pandemic and their already elevated delinquency rates.
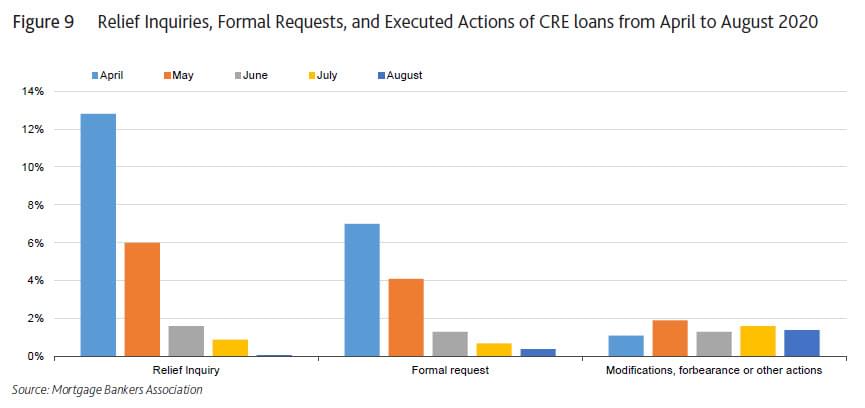
Recognizing the unique importance of loan modification and forbearance in the current environment, the Commercial Real Estate Finance (CREF) Loan Performance Survey, developed by Mortgage Banker Association, tracks the monthly activities of relief inquiries, requests and actions taken. As shown in Figure 9, from April to August 2020, relief inquiries and requests continued to fall, while executed actions including forbearance and modification held relatively steady at 1.5% to 2%. These rates appear to be consistent with other data sources, as described earlier.
4. Conclusion
This study examines the recent performance of the commercial real estate loan portfolios of the four largest lender groups: commercial banks, insurance companies, agencies, and CMBS. We observe a definitive spike in delinquency rates in the CMBS market. Balance sheet lenders, commercial banks, life insurance companies, and agencies all reported noticeable increases in delinquency rates during Q2, albeit at a level substantially lower than that of CMBS. Hotel and retail property types report a much larger number of delinquent loans than other property types. Forbearance and modification rates also increased for all lender groups.
Due to the prevailing practice in granting mortgage forbearance and modification, balance sheet lenders’ nonperforming loan ratios are likely artificially “suppressed” at the moment, which makes it rather challenging to accurately assess the credit risk in their CRE loan portfolios using reported delinquency statistics. This is a new and critical issue that we are coping with when evaluating credit risk under the current environment, and it is crucial to continue monitoring all different aspects of the credit performance metrics as the situation evolves.
1 Other nonfarm nonresidential loans, in regulatory definition, are secured by the non-owner-occupied commercial properties other than multifamily, which has its own regulatory category. Most major commercial property types, including office, retail, industrial and hotel, all fall into this category.
2 Percentage of construction loans over total CRE loans.
3 “Community bank” in this report refers to banks with less than $8 billion in total assets, according to the OCC: https://www.occ.treas.gov/about/who-we-are/organizations/midsize-and-community-bank-supervision/index-midsize-and-community-bank-supervision.html
4 Given the lack of publicly reported statistics, we estimate delinquency rates at the property type level for commercial banks. At the moment, we cannot confidently estimate loan modification and forbearance rates for commercial banks.
Freddie Mac, “Multifamily Securitization Forbearance Report.” July 27, 2020.
Moody’s Analytics, “Coronavirus (COVID-19): Credit Risk Impact on Commercial Real Estate Loan Portfolios.” March 22, 2020.
Moody’s Analytics, “Coronavirus (COVID-19): Credit Risk Impact on Commercial Real Estate Loan Portfolios (September 2020 Update).” September 2020.
Moody’s Analytics, “Qualitative Overlay Factors for CRE Credit Risk Models in the Context of COVID-19.” May 12, 2020. Moody’s Analytics, “COVID-19 and Distress in CMBS Markets.” June 9, 2020.
Moody’s Analytics, “COVID-19 and Distress in the CMBS Markets.” August 3, 2020.
Mortgage Bankers Association, “Commercial and Multifamily Mortgage Delinquency Rates Affected by the Pandemic, but Impact Differs by Property Types.” September 1, 2020.
Mortgage Bankers Association, “Commercial / Multifamily Mortgage Delinquency Rates for Major Investor Groups | Q2 2020.” Wells Fargo & Company, ”2020 Q2 Quarterly Supplement.” July 14, 2020.


